Capture One Tutorial.
The different histograms.
The different histograms.

The histogram is an extremely valuable tool for photographers working in digital format, particularly during the post-processing phase. Firstly, it makes it easier to adjust exposure and luminosity, by providing a visual representation of the distribution of luminance values in an image. But it can also be used to fine-tune contrast: by examining the distribution of pixels between dark areas, midtones and highlights, the photographer can adjust the tonal curve to achieve the desired effect and bring the image to life.
The histogram is a graph graduated as follows:
- The horizontal axis reflects luminosity, with dark tones on the left and highlights on the right.
- The vertical axis represents the number of pixels corresponding to each luminosity. This axis is not usually graduated because the exact number of pixels is not important. Rather, it is the distribution of pixels that is of interest.
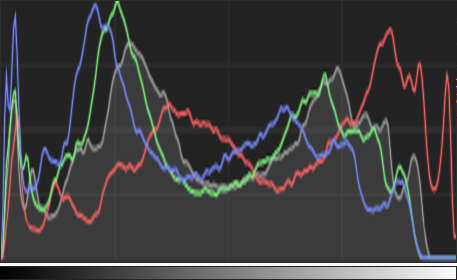
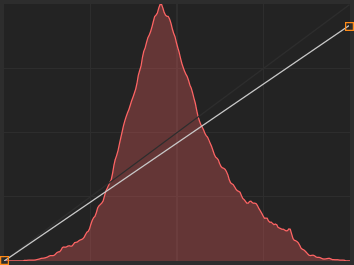
An example of a histogram showing the three primary colours separately.
See also the tutorial specifically devoted to the histogram in digital photography : "Histogram".
Capture One presents a number of histograms in different tool tabs. It's essential to understand the specific features of each of these to interpret them and use them wisely. In this tutorial, you will learn about four histograms available in Capture One, and the situations in which they can be used.
Exposure Evaluation.
This first histogram is found by default in the Capture tab. But as we know, all tabs are customisable: this tool can therefore be inserted in another tab, although it is in the Capture tab that it will be most useful, i.e. when working in connected mode, in the studio (camera connected to the computer and controlled by Capture One).


As its name suggests, this graph gives an idea of the exposure of the photo before adjustment. It is therefore very close to the exposure of the shot. It can be used to correct the exposure if the first photos show that there is room for optimisation.
The few settings that influence this histogram are:
- The basic characteristics, in particular the ICC profile of the camera, and the input curve.
- White balance. Changing the white balance can result in overexposure of one of the primary colours. It is therefore important that the histogram reflects this setting.
- Settings that modify the framing: orientation, cropping. In fact, it is pointless to take into account pixels that will not be in the final image.
- Lens-related corrections, to a limited extent.
- Dehazing tool (
ExposureTab).
Histogram.
Usually displayed at the very top of the Exposure tab.
This tool is a simple display: no action is possible.
The exposure parameters are shown below the graph (sensitivity ISO, exposure time, aperture).


This histogram reflects all the adjustments made to the photo, including local adjustments (made on a layer). It therefore gives a precise idea of the result that will be generated in JPEG or TIF.
Like all the tools, the histogram can be detached from the left-hand side to be displayed as a floating window on the screen (visible at all times, regardless of the tool tab used). When displayed as a floating window, it's a shame that its dimensions are fixed: sometimes you'd like a larger graph.
Levels Histogram.
This histogram is displayed by default in the Exposure tab.
It can be displayed for one of the three primary colours only, or for all three simultaneously.
All adjustments made to the image are taken into account, except for the level setting itself.

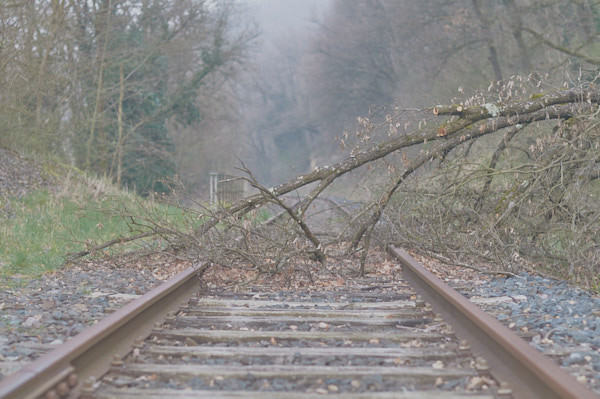
This tool adjusts black, white and grey points. This technique makes it quick and easy to add contrast to a photo that lacks it. This could be the case for photos taken outdoors on a foggy day, or in a studio with white walls and non-directional lighting.
Two picker are used to retrieve the black point and the white point on the image. The graph also shows the luminosity of the pixels under the mouse cursor as a vertical orange line.

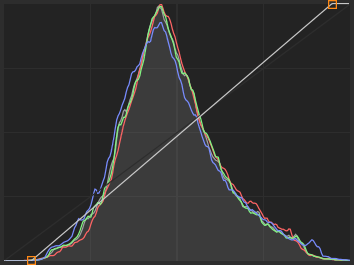
Levels in their initial position
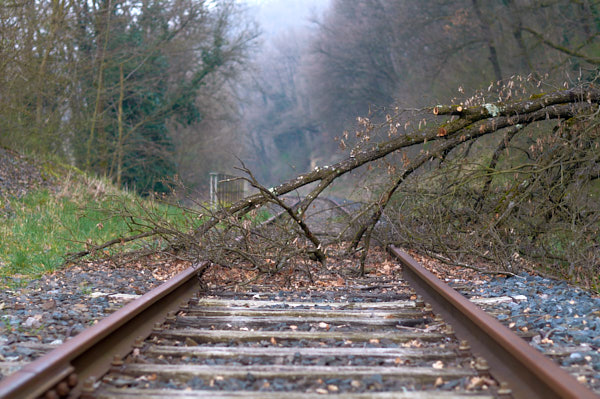

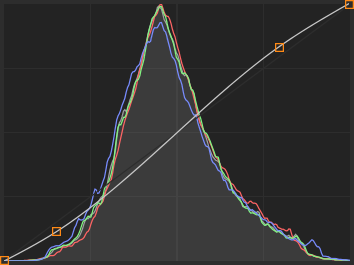
Levels adjusted to optimise photo contrast
Curve Histogram.
This tool is generally positioned close to the previous one, in the Exposure tab.
It represents the histogram on which the curve is superimposed.
The graph reflects all the adjustments already made to the photo, except for itself.

When this tool is detached from the left-hand side to be displayed as a floating window, it can be resized. This makes it easier fine-tuning.
Clicking anywhere on the curve creates a point that can then be moved with the mouse. A new point can also be created by clicking inside the image. Adjustments to the curve are very sensitive: you generally only need to move the points slightly to achieve the desired result.
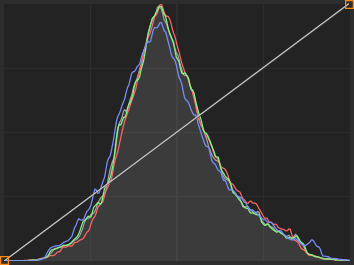
Initial curve, without any modification.
Correction equivalent to adjusting the black and white points.
Addition of two control points: S-shaped curve. This curve shape increases the overall contrast of the image.
One colour curve modification. In this example, to soften a red cast in the image.
Inverted curve: the resulting image will be the negative of the original image.

If you liked this page, share it on your favorite network :