Tutorial - The histogram in digital photography.
The histogram is one of the most useful tools that digital technology has brought to photography. It can be displayed on the back of all cameras, and all processing software can also display it. It can be useful at the time of shooting to get an idea of the tonal distribution in the photo (light and dark tones). It is particularly useful during post-processing to fine-tune the image settings (exposure, contrast, brightness).
During shooting, the histogram is sometimes used to control exposure. However, this method is particularly inaccurate and has several drawbacks:
- The screen on the back of the camera is small and does not allow fine details to be seen.
- The histogram on the back of the camera is built from the JPEG file produced by the camera (the one that is also displayed on the back of the camera). A lot of optimisations and presets have already been applied and the JPEG file has little to do with the original RAW.
- Finally, of course, the photo must already be taken for the histogram to be available.
What is the histogram ?
The histogram represents the distribution of the pixels according to their brightness. The darkest pixels are on the left and the lightest on the right. It is therefore not the height of the curve that indicates the exposure but rather its position on the horizontal axis.
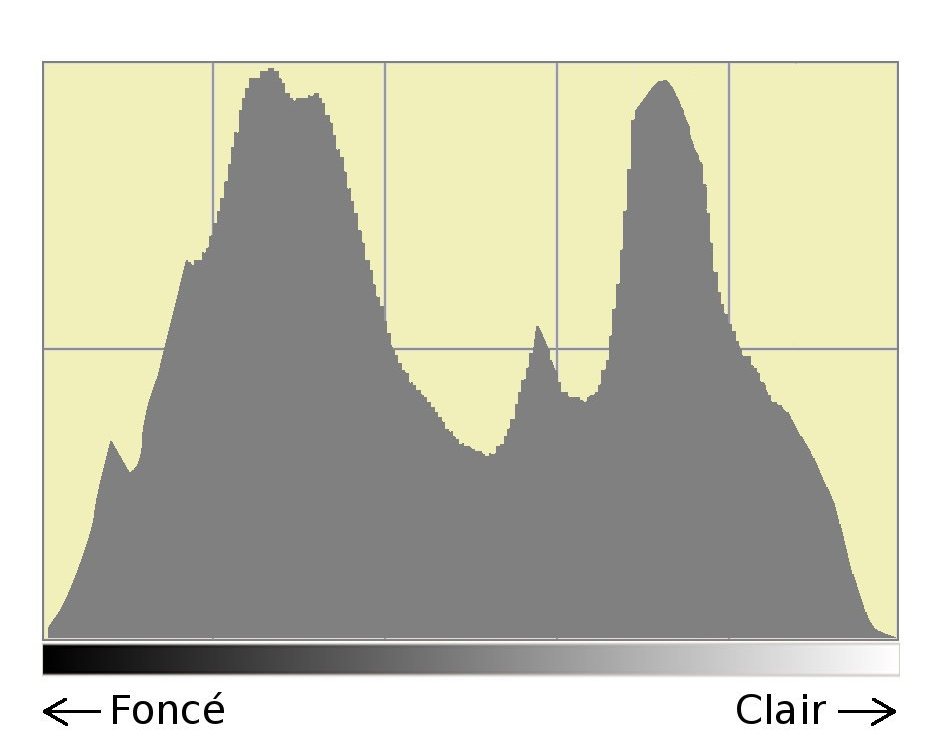
The histogram therefore allows you to check whether the exposure is correct. It is useful during the shooting (on the back of the camera) to decide to redo an over or underexposed photo (we will see this in the following examples). And during the computer processing, it allows you to adjust the settings.
Different presentations of the histogram.
All photo editing software can display the histogram. Most cameras also offer this possibility. That's how important this tool is.
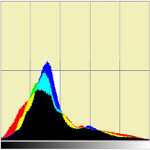
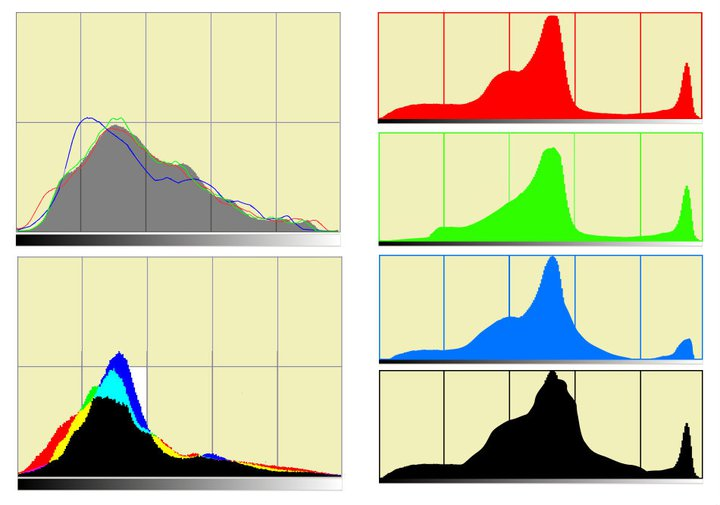
The presentation of the histogram varies greatly from one program to another, but in all cases the interpretation of the histogram is the same. The histogram can sometimes be displayed separately for each of the basic colours (red, green and blue).
Histogram and exposure.
A number of exposure and/or contrast problems can be easily identified by examining the histogram. As we will see from the examples below, it is not sufficient to use the simplistic reasoning of positioning the histogram in the middle of the horizontal axis.
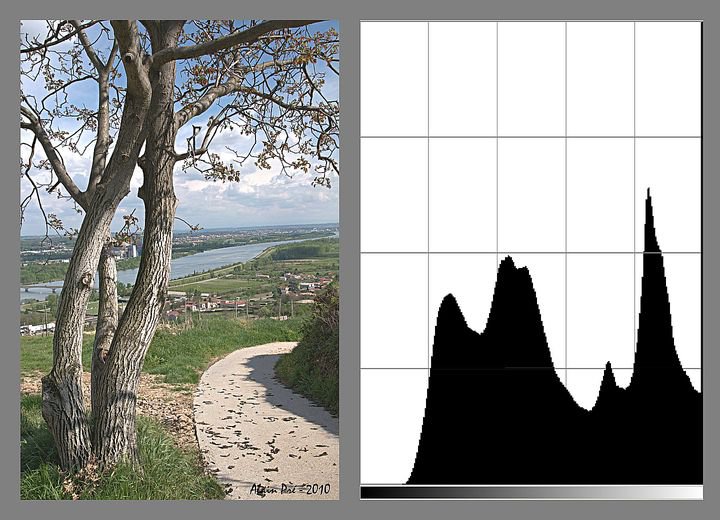
Correct exposure.
the histogram is not truncated either on the right or on the left
The photo opposite is correctly exposed: the histogram does not overflow on the right or on the left. The fact that the curve is not centred is not in itself a problem, as we will see in the two examples that follow. examples that follow.
Correct exposure of a bright subject.

This photo is clear: the pixels are therefore grouped on the right of the histogram. However, the histogram does not seem to be cut off : the photo is not burnt. A burnt photo has completely white areas, with no details.
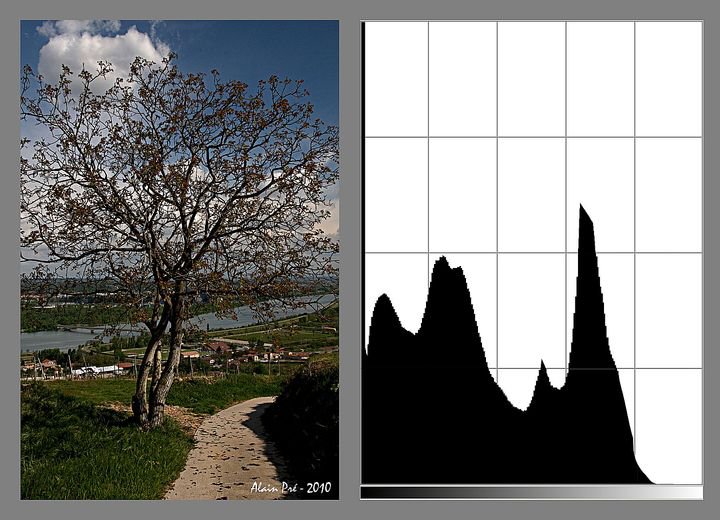
Correct exposure of a dark subject.

Unlike the previous one, this photo is dark: the pixels are therefore grouped on the left of the histogram. The histogram does not seem to be truncated on the left side. The photo therefore does not contain any clipped shadows, i.e. totally black areas, without any details.
Incorrect exposure: presence of clipped shadows.
The histogram is obviously truncated on the left: shadows of the photo are clipped, i.e. there is no more detail in these too black areas. A peak should exist at the extreme left of the histogram but it merges with the edge of the grid. It is of course the areas at the bottom right of the image that is at fault.
Incorrect exposure: presence of burnt areas.
Here the histogram is truncated on the right. The photo therefore contains burnt areas: totally white and without details. A peak exists on the extreme right of the histogram but it often merges with the edge of the grid. It is of course the white clouds that are too bright. Such a large defect will not be difficult to recover on the computer.
Delicate case: very hight contrast.
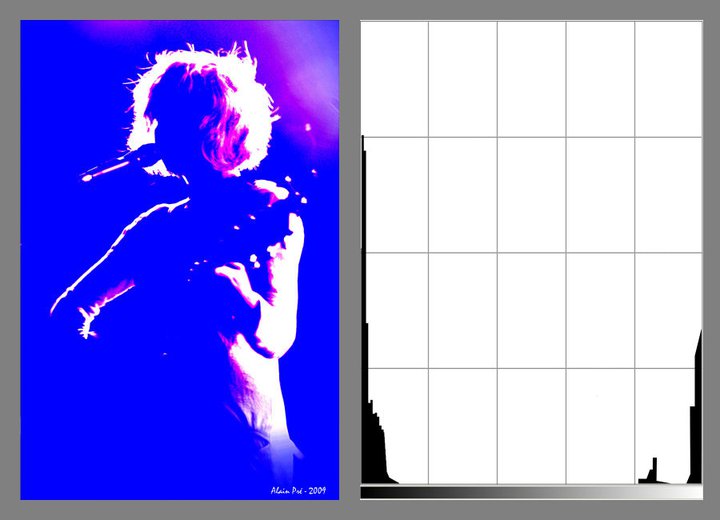
This concert photo (Buridane concert) contains both large blocked areas (underexposed) and overexposed (burnt) areas. The histogram consists of two peaks at the ends. In this case, the result is nevertheless interesting: how technique should not remain the only criterion.
However, how to solve the problem when this situation is not desired ? Suffice to say right away that it is useless to change the settings of the camera: the scene is too contrasted and exceeds the capabilities of the sensor. You have to soften the light itself. This is not always possible; in the case of a concert you cannot change the lights but, in other cases, the light can be softened by interposing a curtain between the source light and the subject, or changing location to place the subject in shade.
Contrast, black point and white point.
The histogram also makes it possible to objectively assess the brightness and contrast of an image. We can therefore make the relevant corrections, without moving the cursors at random.
Lack of contrast.

A histogram that does not span the full width of the graph corresponds to a low contrast image.
The causes can be various. If it is a landscape, the atmospheric veil and often the main cause but other causes may occur.
This can be easily corrected in post-processing as we will see a little later. At the time of shooting, we will simply adjust the exposure so that the curve moves to the right (right exposure) being careful not to overexpose any areas in the image. Doing so will limit the destructive effects of retouching.
The black point and the white point.

Most software offers the manipulation of the black point and the white point directly on the histogram.
Contrast adjustment with black point and white point.
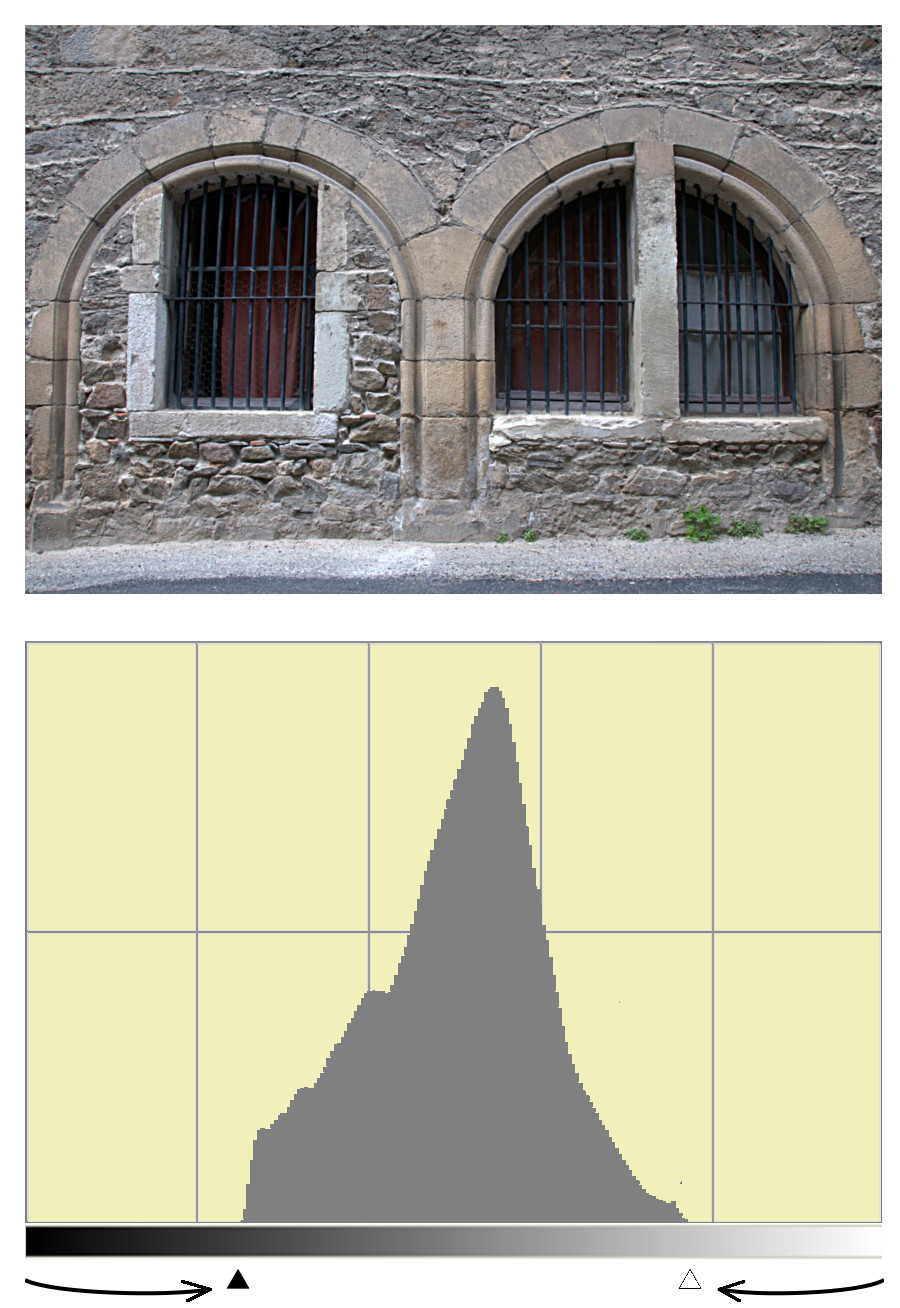
By moving the black point and the white point to bring them to the limit of the curve, we can find better contrast. On a jpeg file, this operation quickly destroys the quality of the image. We will therefore prefer to carry it out on the original file, in RAW format.
Derawtization software (Lightroom, Camera Raw, dxo, Capture One, etc.) offers other methods for adjust the contrast since it usually suffices to move a slider. A glance at the histogram nevertheless makes it possible to ensure that we are not burning (overexposing) or block out (underexpose) certain areas of the image.
Loss of quality.

This histogram is typical of a photo whose contrast has been increased too much. The comb effect reflects a loss of quality. On an image in RAW format, the alteration would have been much less strong.
Atmospheric haze, pollution, haze, fog.
Attenuation of atmospheric haze.
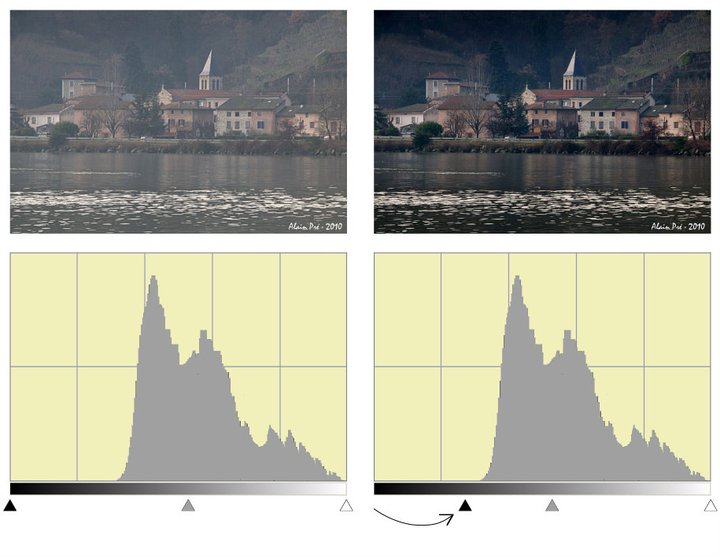
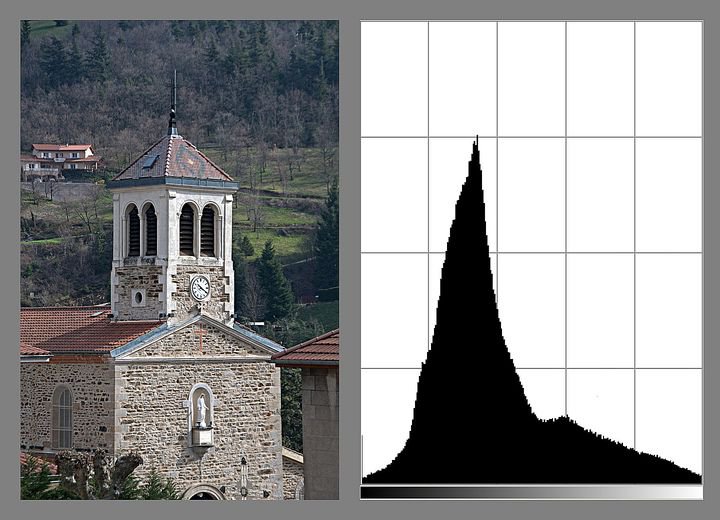
Landscape photos often look dull as if they lacked contrast. This comes from the fact that the air is not perfectly transparent. There is always a bit of haze... or pollution.
In the case of this small village on the banks of the Rhône (France), the veil is quite natural: the rivers or bodies of water in general still generate quite a bit of haze. Even if it is not very sensitive to the naked eye, this mist will give a haze effect to all photos.
Let's move the black point to the beginning of the curve, the photo is immediately better.
Pollution Effect reduction.
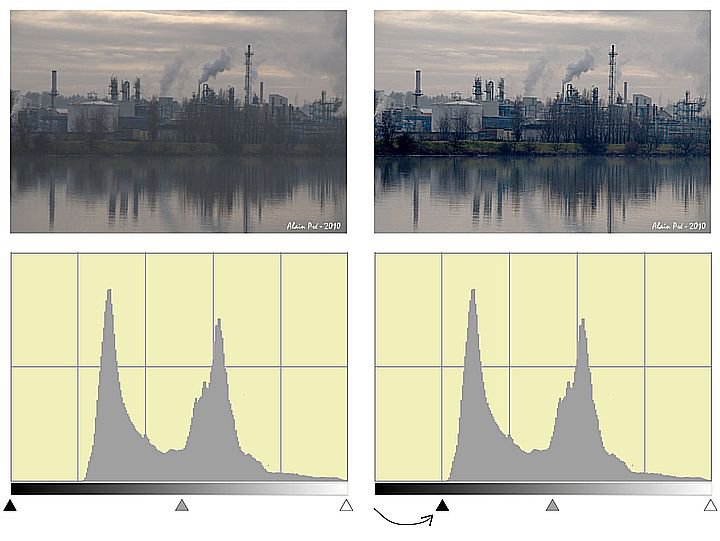
Decrease in the atmospheric veil due to In this second photo, pollution is added to the natural haze: these two phenomena make the air less transparent. This results in a dull photo. Looking at the histogram, you can see the absence of dark tones. We will drag the black dot to the beginning of the curve. The picture is better isn't it ?
Smoky atmosphere of shows or concerts.

Stage effects often use smoke. In addition to disrupting the operation of autofocus, this smoke alters the contrast of the photos: by scattering the light, the smoke makes virtually all dark areas disappear. Again, the black point can be moved to the boundary of the curve, which significantly improves the contrast of the picture.

If you liked this page, share it on your favorite network :